
What is Gantt Chart and What do eCEOs provide you?

Gantt Chart is a visual representation of activities, to show their start and end periods over a time scale. The chart also shows the dependencies between various activities and their relationships.
This is a very popular tool used in Project Management, assisting teams over the years, in planning and scheduling tasks and events.
Some of the project management objectives which are easily achieved via the Gantt chart are mentioned below:
Prepare project schedule: who will cover what and when and determine the activity duration!
Adjust schedules, other changes: cater to changes along with the project execution.
Monitor and publish project progress: understand the project status.
Issues and risks identification: to tackle problems proactively.
Schedule monitoring: to communicate the schedule progress.
Highlight milestone: to define and recognize major project events.
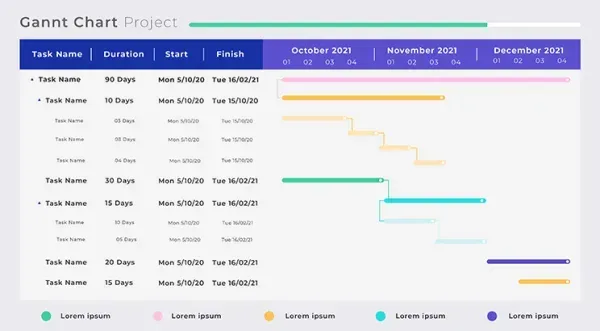
eCEOs understand that Gantt Chart is an indicator. It is automatically generated and is updated as per project progress.
Some of the features of the automated Gantt charts generated by EPMPro, besides fulfilling the above basic expectations, are
Highlight and distribute project information with stakeholders and relevant parties.
Real-time Collaboration and reporting.
Import, export, and third-party application integrations.
Ready to Deliver Your Strategic Initiative?
Where you are transforming your enterprise, building energy capability or delivering national-scale programmes - The eCEOs delivers.
Delivering transformation with expertise in project excellence, digital solutions, energy and nuclear advisory


© 2026 eCEOs. All Rights Reserved
Company
Locations
Kuala Lumpur HQ
2B-05-02, Block 2B,
Plaza Sentral,
Jalan Stesen Sentral 5,
50470 Kuala Lumpur,
MALAYSIA
+60 327735665
+60 327735668
Indonesia | Singapore | India